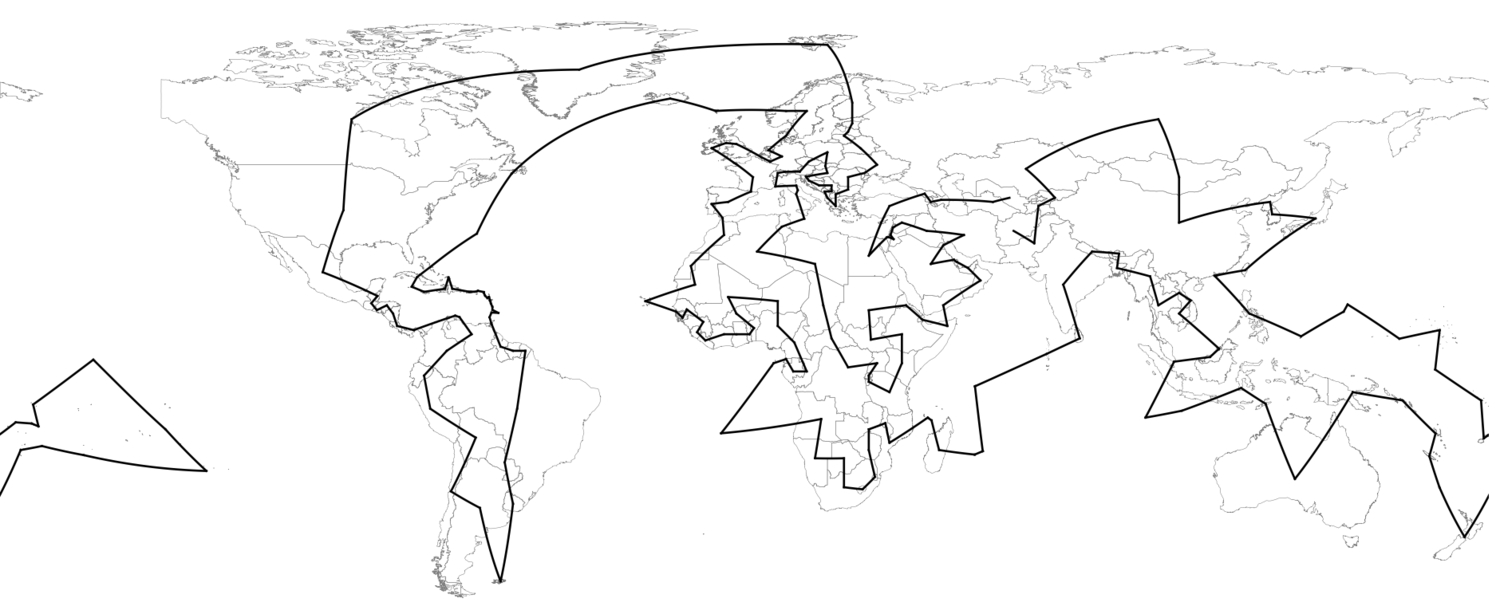
The Travelling Salesman Problem (TSP) is a graph theory problem that requires the most efficient, i.e. shortest, closed-loop path through which a salesman can travel to each of n cities, exactly once [1]. Such a loop is called a Hamiltonian cycle [2] and there is no known general solution to the TSP. Practical applications to the solution of the TSP include the scheduling of tasks on a computer and ordering of genome features [3]. Inspired by the last example on this page, I tried projecting the shortest path through every country on the planet and visualising it on a map. To do this, I used the FindShortestTour function, which tries to find the shortest path through all the countries—going through each country once.
I used the following code to gather the names of the countries in the world and to find the shortest path going through the centre of each country.
1c = CountryData["Countries"];2geocen = Map[CountryData[#, "CenterCoordinates"] &, c];3{dis, path} = FindShortestTour[geocen];
Next, I visualised the results on a map using the following code.
1Export["mapflat.svg",2 GeoGraphics[{3 FaceForm[White],4 EdgeForm[{Thin, Gray}],5 Polygon[c],6 GeoPath[c[[path[[1 ;; Length@c]]]]]7 }, GeoRange -> "World", GeoBackground -> None, ImageSize -> 700]8]

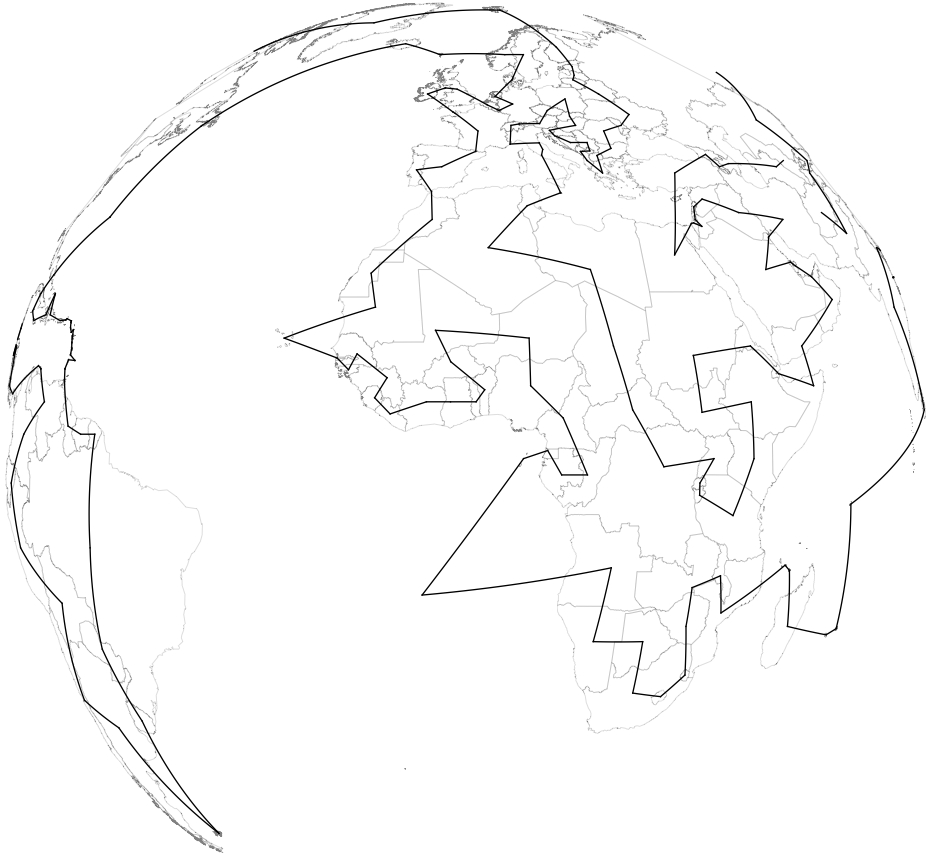
To view the path using an orthographic projection:
1GeoGraphics[{2 FaceForm[White], EdgeForm[{Thin, Gray}], Polygon[c],3 GeoPath[c[[path[[1 ;; Length@c]]]]]},4 GeoRange -> "World",5 GeoProjection -> {"Orthographic", "Centering" -> CountryData["World", "CenterCoordinates"]},6 GeoBackground -> None, ImageSize -> 700]

I then created an animation of the travelling salesman going around the globe.
1Export["animation.gif",2 GeoGraphics[{GeoStyling[FaceForm[White], EdgeForm[{Thin, Gray}]], Polygon[CountryData["Countries"]], GeoStyling[FaceForm[Orange]], Polygon[c[[path[[#]]]]], {Gray, GeoPath[geocen[[path[[1 ;; #]]]]]}},3 GeoRange -> "World", GeoProjection -> {"Orthographic", "Centering" -> geocen[[path[[#]]]]}, GeoBackground -> None, ImageSize -> 300] & /@ Range@(c+1),4 ImageResolution -> 300, "DisplayDurations" -> 1.5]

As the travelling salesman moves to the next country, the centre of projection also moves to that country. The animation begins with Afghanistan because the list of countries CountryData["Countries"] returned was arranged in alphabetical order. Bear in mind that this is an attempt at finding the shortest path, going through the geographic centre of each country, which results in a distance of about 112,312 miles. This distance can be reduced in a few ways -- taking a different route for instance, or, starting from a different country.
— MS
[1] Weisstein, Eric W. "Traveling Salesman Problem." MathWorld.
[2] Weisstein, Eric W. "Hamiltonian Cycle." MathWorld.
[3] Erica Klarreich (2013)